MHServerEmu Progress Report: September 2024

You know the drill, it’s progress report time.
WTB Godly Plate of the Whale
This month we released our third stable version, 0.3.0, and immediately I started working on features for 0.4.0, which is currently planned for early December.
The first thing on my “to do” list was implementing item affix generation. When I did the loot table implementation back in July, I already knew that it would not be difficult to get affix generation up and running with what we already had. However, I wanted to wait until we had persistence working: there is no worse feeling in a loot game than getting a good drop and knowing you are going to lose it as soon as you log out.
Here is an overview of how affix generation works. After the ItemResolver goes through a loot table, you end up with an ItemSpec that has the item’s base type, quality, and level, but no affixes. This ItemSpec is passed to a function called LootUtilities.UpdateAffixes() that does the real magic.
Based mainly on the item’s base type and level, the game rolls a number of category affixes and position affixes.
Categories are data-defined pools, which in practice are primarily used for “white” affixes you see on gear, like damage rating and health. Theoretically it should be possible to add more affix categories by changing game data, although you will have to modify both the server and the client .sip files.
There are 19 affix positions, and they are hardcoded into the game: unlike categories, you cannot add or remove new affix positions without recompiling the client. Available positions include things that are typical for games in this genre, like prefixes and suffixes, but also more specialized options, such as PetTech-specific affixes. Here is a full list of affix positions that exist in version 1.52:
| Prefix | Unique | PetTech1 | RegionAffix |
|---|---|---|---|
| Suffix | Blessing | PetTech2 | Socket1 |
| Visual | Runeword | PetTech3 | Socket2 |
| Ultimate | TeamUp | PetTech4 | Socket3 |
| Cosmic | Metadata | PetTech5 |
For each affix roll a pool is formed based on various filters, including compatibility with the base type, keywords, categories, and the region the affix is being rolled in. An affix is then picked from this pool, checking for duplicates that are already attached to this ItemSpec if needed. Some affixes also require an additional parameter, referred to as its scope: the most typical example of this are affixes that affect specific powers or groups of powers. For an affix like +3 to Repulsor Barrage the scope would be a reference to the prototype for the Repulsor Barrage power, while for +10% Area Power Damage it would be a reference to the prototype for the Area keyword. The scope system is a good example of how surface-level many BUE changes actually were: although power ranks were “removed”, the entire backend for them still exists and is in use, with all powers simply being set to rank 1 and rebalanced accordingly.
With affixes picked and added to the ItemSpec, it is now time to apply it to an Item entity instance. This is when the actual rolling of values happens. The funny thing about this process is that it is done in parallel by the server and the client: rather than sending a fully rolled item, the server sends the client a serialized ItemSpec that also contains a seed for the random number generator. Because the input data and the algorithm are the same between the two of them, they both generate the same item independently from one another. While this means we have all the logic for the rolling process client-side, any deviation from it also causes desynchronization issues. In addition to that, you can’t modify most of the static item data, such as affix ranges, server-side without also having to change the client.
In addition to randomly picked affixes, the prototypes for base types can also have built-in affixes, and built-in properties. The vast majority of fixed stat items you see in the game, like uniques and artifacts, are implemented using built-in properties. The core difference between them is that affix properties are attached to the item as child property collections and can be removed, while built-in properties are written right into the item’s own property collection.
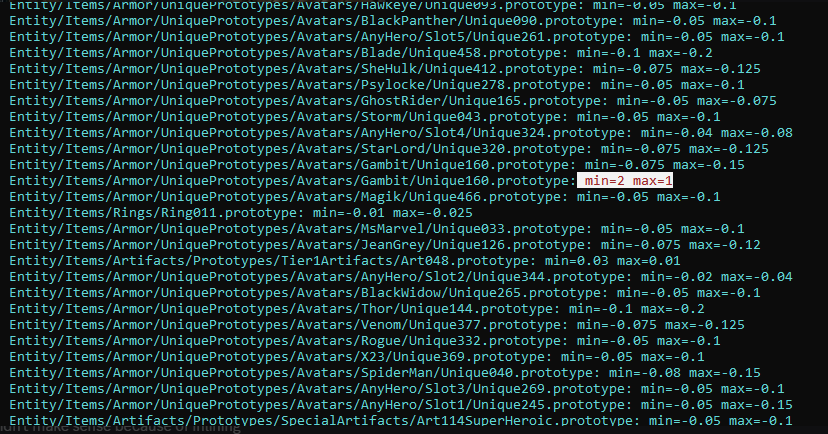
Implementing built-in properties initially caused unexpected game instances crashes. Turns out, the data contains mistakes made by designers, and in some cases minimum and maximum ranges are mixed up. Generally it’s negative decimal numbers, like -0.1 and -0.2, but there are also cases that look like this:
Here is the default implementation of Math.Clamp() in C#:
public static int Clamp(int value, int min, int max)
{
    if (min > max)
    {
        ThrowMinMaxException(min, max);
    }

    if (value < min)
    {
        return min;
    }
    else if (value > max)
    {
        return max;
    }

    return value;
}
So when you try to clamp a value to a mixed up range like this, an exception is thrown, which leads to a crash. We cannot fix the issue with the data without also modifying the client, so what we have to do here is remove the min > max check to process malformed data in the same way as the client, or we are going to get different rolls server-side and end up with desync issues.
With affixes actually rolling and applying, it was now time to take another look at combat calculations. The version of the game we are currently working on uses a form of level scaling called dynamic combat level (DCL). Surprisingly enough, it is actually not that complicated compared to most other systems in this game: all damage players deal to mobs and receive from mobs is scaled as if the mob was the same level as the player (with upper and lower bounds for this scaling defined by the region). Enemy health never actually changes, and the illusion of enemies scaling up or down to player level is created by sending fake damage numbers to the client. So if you would deal 100 damage to a target of your level, it gets scaled to 1000 to match the target’s higher level, but the client receives and displays the number 100.
It would not be Marvel Heroes if there was no jank at all though. When the DCL system was initially being implemented, it was made in a way where it could be turned off. For this reason all mobs in the game have two health curves: the default one and the “new” DCL one. The main difference between them is that while default curves have separate baseline scaling for regular mobs and bosses, the new DCL curves are unified, and the difference is achieved by applying external health multipliers. In the vast majority of cases this multiplier comes from the mob’s rank (Popcorn, Champion, Elite, MiniBoss, Boss), but sometimes it is baked into the mob’s prototype itself. This was the reason why some mobs, like Doop, were nearly unkillable before: they were using their default health curves that had baseline scaling and they also had a crazy high multiplier bonus that was applied on top of that.
With players having items with stats, the DCL system being mostly implemented, and characters using proper health curves with multipliers applied to them, everything in the game now has a much more authentic feel to it, with proper contrast between weaker popcorn mobs and tougher elites. There is still lots and lots of work to do on this front, but I feel we are in a much better place balance-wise now.
And This… Is to Go Even Further Beyond!
As MHServerEmu matures and more features are implemented, the workload the server has to do increases. Even 0.3.0, with its basic combat and loot generation, already starts coming apart at the seams with high enough load, and with missions and metagames coming in 0.4.0, this month I decided it was time to take a good look at what we can do to optimize the server.
Round 1: Memory Management
The core difference between our server implementation and the original game is that MHServerEmu is written in C#, which compiles to bytecode and has automatic memory management, while the client is C++ compiled to native code with manual memory management. The biggest advantage of using C# for this project is that it’s great for rapid iteration with fast build times and features like hot reload, and more often than not it just works. However, there is an inherent loss of control compared to C++, the most critical point being how memory is managed.
Both languages use the concepts of the stack and the heap for managing memory. I will not go into too much detail on this, as there are countless other resources that go as deep into this as you will ever want, and do a much better job at it than I can, but here is the gist of it:
-
Stack-allocated data is cleared automatically after you leave the block of code that contains the allocation. Working with the stack is very fast, but it has relatively small size (1 MB by default in C#), and if you exceed this limit, you will get the infamous stack overflow error. So generally you want to use this for smaller temporary data with short lifespans.
-
Anything allocated on the heap needs to be cleaned up at some point. In C++ this can be done in various ways, while C# does it automatically using its garbage collector (GC). Working with the heap is much slower than the stack, but it can handle significantly larger volumes of data with longer lifespans.
-
In C++ pretty much anything can be allocated either on the stack or on the heap. C# restricts this by dividing types into value types and reference types: there are exceptions and edge cases, but the general idea is that reference types cannot be allocated on the stack, and there are cases when value types have to be wrapped in reference types, which forces them to be allocated on the heap. This wrapping process is called boxing.
As a result of this, in C++ if you are not careful with your memory management, you will end up continuously allocating more memory than you free, eventually completely running out of it. This is what is commonly referred to as a memory leak. In languages like C# it’s a lot harder to get a memory leak like this, but it’s still very easy to unintentionally end up doing too many heap allocations, increasing garbage collection pressure, which manifests as unpredictable stuttering, as the garbage collector periodically suspends all threads to do its work. This is made worse by the fact that C# has limited tools for stack allocations, and some features end up allocating garbage behind the scenes.
While Marvel Heroes has a relatively loose simulation time step of 50 ms, there is also a lot of stuff going on, so the amount of garbage you generate can get very out of hand very fast. Here are some examples of the issues I have recently identified and fixed.
Arrays
By default, arrays in C# are reference types. This means when you create a new array like this…
byte[] buffer = new byte[1024];
…you are allocating 1024 bytes on the heap that the garbage collector will have to reclaim at some point. This is not too bad when it’s done every once in a while, but what if you are doing this tens of thousands of times per second?
As I was profiling our memory allocations, I discovered that we had literally millions of double[] allocations happening every minute. The culprit wasn’t even our own code: we are using a third party library that implements fast robust predicates for computational geometry, which is a way of quickly testing points in space with a high degree of accuracy. The original implementation is written in C, and instead of adapting it to C# ourselves, we used an existing port.
However, as I looked at the code, I started seeing parts like this:
double[] finswap;
double[] temp16a = new double[16];
double[] temp32a = new double[32];
double[] temp16b = new double[16];
double[] temp32b = new double[32];
double[] temp16c = new double[16];
double[] temp48 = new double[48];
double[] axtbc = new double[8];
These tests are used extensively in the game for updating the navi system, and they can cause millions of heap allocations in just a few minutes of playing. Thankfully, this is temporary data that gets thrown away as soon the function finishes, so we can make use of one of the optimization tools available in C# - Span<T>:
Span<double> finswap = stackalloc double[0];
Span<double> temp16a = stackalloc double[16];
Span<double> temp32a = stackalloc double[32];
Span<double> temp16b = stackalloc double[16];
Span<double> temp32b = stackalloc double[32];
Span<double> temp16c = stackalloc double[16];
Span<double> temp48 = stackalloc double[48];
Span<double> axtbc = stackalloc double[8];
Doing it this way we break the “rules” of C# arrays a bit and allocate them on the stack. Behind the scenes this is actually a way of writing unsafe code that looks like this:
double* temp16aPtr = stackalloc double[16];
Span<double> temp16a = new(temp16aPtr);
Spans are essentially highly limited pointers that allow us to use some C# features that had been traditionally restricted to unsafe code, such as the stackalloc keyword. They are very useful for situations like this, although with an external library it may be worth rewriting it in fully unsafe code to get more performance out of it in the future. Our span-based fork of this robust predicates implementation is available on GitHub for everyone to use.
Replacing arrays with spans works for smaller arrays, but what about those that can potentially exceed the 1 MB stack limit or need to persist for longer periods of time? The best example of this are byte[] buffers used for serializing network messages and player data. This is where another useful optimization tool comes in: ArrayPool<T>. Instead of allocating a new buffer each time like this:
int size = packet.SerializedSize;
byte buffer = new byte[size];
packet.Serialize(buffer);
Send(buffer, size);
We can “rent” and later reuse the same buffers:
int size = packet.SerializedSize;
byte buffer = ArrayPool<byte>.Shared.Rent(size);
packet.Serialize(buffer);
Send(buffer, size);
ArrayPool<byte>.Shared.Return(buffer);
There are certain limitations to using ArrayPool<T>: for example, you will most likely get a buffer larger than what you requested, and you will have to handle this yourself. However, it works very well for cases like high-volume packet serialization.
This was a very simple example where integrating pooling was just two lines of code. Unfortunately, things are not always this easy. For client compatibility reasons we are using protobuf-csharp-port, a legacy C# implementation of Google’s Protocol Buffers (protobufs) that was last updated in 2015. Gazillion utilized certain protobuf encoding functions directly for their custom archive format, which is used for high-frequency messages, like entity creation, locomotion updates, and power activations.
These encoding functions can be accessed in protobuf-csharp-port using the CodedOutputStream class. CodedOutputStream is a wrapper for various Stream implementations, like a protobuf-specific version of BinaryWriter. You can create CodedOutputStream instances using various overloads of the CreateInstance() factory method, but there is a problem: you can provide your own fixed-size buffer to write to directly, or you can provide a stream and specify the size of the write buffer. However, the constructor for CodedOutputStream is private, and there is no CreateInstance() overload that accepts both a stream and a buffer:
private CodedOutputStream(Stream output, byte[] buffer)
{
    this.output = output;
    this.buffer = buffer;
    this.position = 0;
    this.limit = buffer.Length;
}

public static CodedOutputStream CreateInstance(Stream output, int bufferSize)
{
    return new CodedOutputStream(output, new byte[bufferSize]);
}
The “normal” thing to do here would be either to accept that we will waste allocations on this, or to just bite the bullet and start modifying protobuf-csharp-port for our needs. However, I am stubborn, and I felt like doing the latter would be like opening the Pandora’s box: we may end up doing it at some point, but now was not the right time. Modern problems require modern solutions, and here is the one I came up with:
public static class CodedOutputStreamEx
{
    private static readonly Func<Stream, byte[], CodedOutputStream> CreateInstanceDelegate;

    static CodedOutputStreamEx()
    {
        Type[] argTypes = new Type[] { typeof(Stream), typeof(byte[]) };

        DynamicMethod dm = new("CreateInstance", typeof(CodedOutputStream), argTypes);
        ILGenerator il = dm.GetILGenerator();

        il.Emit(OpCodes.Ldarg_0);
        il.Emit(OpCodes.Ldarg_1);
        il.Emit(OpCodes.Newobj, typeof(CodedOutputStream).GetConstructor(BindingFlags.NonPublic | BindingFlags.Instance, argTypes));
        il.Emit(OpCodes.Ret);

        CreateInstanceDelegate = dm.CreateDelegate<Func<Stream, byte[], CodedOutputStream>>();
    }

    [MethodImpl(MethodImplOptions.AggressiveInlining)]
    public static CodedOutputStream CreateInstance(Stream stream, byte[] buffer)
    {
        return CreateInstanceDelegate(stream, buffer);
    }
}
Here we are using System.Reflection.Emit to pretty much generate a new CodedOutputStream.CreateInstance() overload at runtime, which we then access via a cached delegate. Is it an overengineered hack? Yes. Does it work? Also yes.
With these targeted applications of Span<T> and ArrayPool<T> we were able to get arrays under control and eliminate literally millions of unnecessary heap allocations. Nevertheless, this was just one stop in my optimization journey.
Boxing
Boxing is what occurs in C# when a value type is cast to a reference type. Here is the simplest example of this:
int value = 5;
object boxedValue = (object)value;
Because int is a value type and object is a reference type, and reference types cannot exist on the stack in C#, this conversion requires allocating an object instance on the heap that will contain our value.
In a simple example like this boxing is clear to see if you know about value and reference types, but some of the “automagical” C# features can cause unintentional boxing and heap allocations. One common pitfall for this are interfaces: interfaces are inherently reference types, so when a struct, a value type, implements an interface like IEnumerator, and is then cast to an instance of this interface, it will end up being boxed.
Here is an example of a very simplified wrapper class that implements the IEnumerable interface:
public class PowerCollection : IEnumerable<Power>
{
    private List<Power> _powers;

    public IEnumerator<Power> GetEnumerator()
    {
        return _powers.GetEnumerator();
    }

    // Legacy non-generic version of GetEnumerator() required by IEnumerable here
}
When you have it like this, you can very conveniently iterate all Power instances in your PowerCollection in a foreach loop:
foreach (Power power in PowerCollection)
    power.EndPower();
Here is a problem though: List<T> uses a struct-based enumerator to avoid heap allocations, but when you iterate like this, here is what is actually happening behind the scenes:
using (IEnumerator<Power> enumerator = PowerCollection.GetEnumerator())
{
    while (enumerator.MoveNext())
    {
        Power power = enumerator.Current;
        power.EndPower();
    }
}
As a result, your List<T>.Enumerator struct is cast to IEnumerator and boxed. You end up doing completely unnecessary heap allocations out of nowhere, and if you are iterating hundreds or even thousands of times per second, it can really add up.
The solution is to add a separate GetEnumerator() implementation for your wrapper classes that returns a concrete enumerator type:
public class PowerCollection : IEnumerable<Power>
{
    private List<Power> _powers;

    public List<Power>.Enumerator GetEnumerator()
    {
        return _powers.GetEnumerator();
    }

    IEnumerator<Power> IEnumerable<Power>.GetEnumerator()
    {
        return _powers.GetEnumerator();
    }

    // Legacy non-generic version of GetEnumerator() required by IEnumerable here
}
This way you avoid boxing when doing a simple foreach iteration, but also still have access to various IEnumerable extension methods, like Select() and Where().
yield return
Related to iteration and boxing is another source of garbage: yield return. Looking again at the example above, it can also be implemented like this:
public class PowerCollection : IEnumerable<Power>
{
    private List<Power> _powers;

    public IEnumerator<Power> GetEnumerator()
    {
        foreach (Power power in _powers)
            yield return power;
    }

    // Legacy non-generic version of GetEnumerator() required by IEnumerable here
}
This is a quick and dirty way of implementing a custom iterator, which can be great for getting complex filtered iteration up and running. However, behind the scenes this actually creates a state machine object that causes more heap allocations. So to optimize this, I went back and replaced some of our yield return filtered iteration implementations with struct-based IEnumerator implementations. It is a more verbose way of doing things, but it prevents more unnecessary garbage.
Delegates
Delegates in C# are objects that encapsulate function pointers. They are reference types, which means more heap allocations. And sometimes they happen when you do not expect it.
A good of example of this is one of the iteration methods of PropertyCollection:
public PropertyList.Iterator IteratePropertyRange(PropertyEnumFilter.Func filterFunc)
{
    return _aggregateList.IteratePropertyRange(filterFunc);
}
This takes a filter delegate defined in the PropertyEnumFilter static class as an argument:
public static class PropertyEnumFilter
{
    public delegate bool Func(PropertyEnum propertyEnum);

    // A filter function that skips properties that don't have a valid aggregation method
    public static bool Agg(PropertyEnum propertyEnum)
    {
        PropertyInfo info = GameDatabase.PropertyInfoTable.LookupPropertyInfo(propertyEnum);
        return info.Prototype.AggMethod != AggregationMethod.None;
    }
}
The most intuitive way of using it looks like this:
foreach (var kvp in Properties.IteratePropertyRange(PropertyEnumFilter.Agg))
{
    // Do something with properties
}
But here is yet another pitfall: this
PropertyEnumFilter.Func aggFunc = PropertyEnumFilter.Agg;
is actually a short way of writing this:
PropertyEnumFilter.Func aggFunc = new(PropertyEnumFilter.Agg);
So every time you pass a function as an argument, you end up instantiating an extra delegate. The garbage-free way of doing this actually looks like this:
public static class PropertyEnumFilter
{
    public delegate bool Func(PropertyEnum propertyEnum);

    public static Func AggFunc { get; } = Agg;

    // A filter function that skips properties that don't have a valid aggregation method
    private static bool Agg(PropertyEnum propertyEnum)
    {
        PropertyInfo info = GameDatabase.PropertyInfoTable.LookupPropertyInfo(propertyEnum);
        return info.Prototype.AggMethod != AggregationMethod.None;
    }
}
Which you then use like this:
foreach (var kvp in Properties.IteratePropertyRange(PropertyEnumFilter.AggFunc))
{
    // Do something with properties
}
This little maneuver’s gonna save us 800 000 allocations on server startup.
Stack-like Pooling
Sometimes you just need a way of imitating C++’s “allocate whatever on the stack” behavior. A good example of this is PropertyCollection: it is a pretty heavy data structure that is occasionally used just as a way of transferring data. For instance, when you create an Entity, you can pass it a PropertyCollection as a parameter, and all properties in it will be copied to the freshly created Entity. This temporary PropertyCollection has a very short lifespan, never leaves its initial scope, and the client actually uses stack allocations for it. However, in C# “we don’t do that here”, so we need a workaround.
The one I have implemented involves an approach similar to what is used for database connections. We define an interface for poolable objects:
public interface IPoolable
{
    public void ResetForPool();
}
And then we create a manager singleton:
public class ObjectPoolManager()
{
    public ObjectPoolManager Instance { get; } = new();

    private ObjectPoolManager() {}

    public T Get<T>() where T: IPoolable, new()
    {
        // Retrieve or create a new object of type T
    }

    public void Return<T>(T instance) where T: IPoolable, new()
    {
        instance.Clear();
        // Return a previously created object to the pool
    }
}
Now we can implement two interfaces on objects that we want to use in a stack-allocated fashion:
public class PropertyCollection : IPoolable, IDisposable
{
    // The rest of the class

    public void ResetForPool()
    {
        Clear();
    }

    public void Dispose()
    {
        ObjectPoolManager.Instance.Return(this);
    }
}
And now we can use it like this:
using PropertyCollection tempProperties = ObjectPoolManager.Instance.Get<PropertyCollection>();
When we leave the scope where we got this collection, in a very stack-like fashion our PropertyCollection is “disposed” thanks to the using keyword, which in this case returns it to the pool and clears it. This reduces the number of PropertyCollection allocations we need to do from hundreds of thousands to just 3 or 4 per game instance.
Round 2: Game Database Initialization
Hello darkness, my old friend. Those of you who have been following these reports since the beginning will remember our earlier, many months-long struggle with implementing the game database. Eventually everything got to a functional state, but I was never really happy with how well it performed. Not only did it take pretty long to start if you were preloading all prototypes (about 14.5 seconds on my machine), even when loading prototypes on demand you would occasionally get long lags when defeating certain enemies for the first time, caused by their loot tables being deserialized. So with this optimization pass I was determined to dive back into the abyss and try to make it better.
Pak Files
The very first thing that happens when you start MHServerEmu is the initialization of the PakFileSystem. All game data files are stored in .sip packages that consist of a header, an entry table, and raw data for all files compressed using the LZ4 algorithm. Both the client and our server implementation read the header and the entry table, and then load the compressed data for all files into RAM. When files need to be decompressed and deserialized, their data is taken from RAM rather than disk. This may seem wasteful at first, but this is actually much faster than performing file system IO operations thousands of times.
Previously, we were loading data for each file into separate byte[] buffers. As I was rechecking all of our libraries after I discovered the issues with RobustPredicates, I noticed that our LZ4 implementation, K4os.Compression.LZ4, actually accepts ReadOnlySpan<T> and Span<T> as arguments. Before, we were looking at spans as a way of doing stack allocations for arrays, but they have another use: “slicing” an array. A span is essentially just a way of representing regions of memory, and you can represent different sections of the same array as different spans.
So I had an idea for of dealing with .sip packages more efficiently: rather than reading data for each file into separate buffers, we could just read everything into a single large buffer, and slice it with spans on decompression. While it wasn’t really what the file format was designed for, it was easy to implement thanks to the fact that all file entries are in the same order as their data that follows, so the total size of the data section can be easily calculated from the last entry as follows:
int numEntries = reader.ReadInt32();
_entryDict.EnsureCapacity(numEntries);

PakEntry newEntry = default;

for (int i = 0; i < numEntries; i++)
{
    newEntry = new(reader);
    _entryDict.Add(newEntry.FilePath, newEntry);
}

int dataSize = newEntry.Offset + newEntry.CompressedSize;
_data = reader.ReadBytes(dataSize);
Doing it this way doubled the performance of this initial step, reducing the time it takes from 200 to 100 ms on my machine. The real challenge still awaited me though.
Prototype Copying
While my initial assumption was that our performance issues were caused by overreliance on System.Reflection.PropertyInfo.SetValue() for assigning deserialized field values, to my surprise, it wasn’t actually that bad: even when I did some tests and tried implementing caching and eliminating boxing, it made practically no difference. However, profiling revealed the actual culprit: CalligraphySerializer.CopyPrototypeFields(), which is called 625 772 times when doing a full server initialization. Within it there were two issues that were absolutely killing our performance.
The first issue was pretty straightforward: we were calling GetProperties() to get an array of C# PropertyInfo instances for the prototype type that is being copied. Not only GetProperties() is more costly than I thought, we were actually redoing the work of filtering non-Calligraphy fields each time. By implementing caching here, we reduced the number of GetProperties() calls and subsequent filtering to just 877, giving us a noticable boost.
But the real gains were in solving the second issue, that lied within the AssignPointedAtValues() function called in CopyPrototypeFields():
private static void AssignPointedAtValues(Prototype destPrototype, Prototype sourcePrototype, System.Reflection.PropertyInfo fieldInfo)
{
    fieldInfo.SetValue(destPrototype, fieldInfo.GetValue(sourcePrototype));
}
This little line of naive reflection runs 7 317 481 times during full server initialization, and it used to take about 2750 out of 14500 ms it took to load all prototypes on my machine. There are much better ways of handling this, and at first I went for the most obvious one you see recommended: using expression trees to compile and cache delegates:
public static void CopyValue<T>(this PropertyInfo propertyInfo, T source, T destination)
{
    if (CopyPropertyValueDelegateDict.TryGetValue(propertyInfo, out Delegate copyValueDelegate) == false)
    {
        ParameterExpression sourceParam = Expression.Parameter(typeof(object));
        ParameterExpression destinationParam = Expression.Parameter(typeof(object));

        Type type = propertyInfo.DeclaringType;

        UnaryExpression castSourceParam = Expression.Convert(sourceParam, type);
        UnaryExpression castDestinationParam = Expression.Convert(destinationParam, type);

        MethodCallExpression getCall = Expression.Call(castSourceParam, propertyInfo.GetGetMethod());
        MethodCallExpression setCall = Expression.Call(castDestinationParam, propertyInfo.GetSetMethod(true), getCall);

        copyValueDelegate = Expression.Lambda<CopyValueDelegate>(setCall, sourceParam, destinationParam).Compile();
        CopyPropertyValueDelegateDict.Add(propertyInfo, copyValueDelegate);
    }

    var copy = (CopyValueDelegate)copyValueDelegate;
    copy(source, destination);
}
This generates and caches functions for every encountered prototype/C# property combination that are equivalent to this:
void CopyValue(Prototype source, Prototype destination)
{
    ((SomePrototype)destination).SomeProperty = ((SomePrototype)source).SomeProperty;
}
This did give me a performance boost, reducing the time it took from 2750 to about 1750 ms. However, as I looked more closely at what was taking time, I realized that creating and compiling expression trees took about 1050 ms, with only 700 ms spent on the actual workload. While it was more efficient than naive reflection, it was obvious I was still missing out on performance.
I had to descend deep into the forbidden archives of Microsoft Learn and seek the dark knowledge of System.Reflection.Emit. Rather than relying on an abstraction in the form of expression trees, I had to throw away what remained of my humanity and look into the abyss of the Microsoft Intermediate Language (MSIL) directly. The end result looks like this:
public static void CopyValue<T>(this PropertyInfo propertyInfo, T source, T destination)
{
    if (CopyPropertyValueDelegateDict.TryGetValue(propertyInfo, out Delegate copyValueDelegate) == false)
    {
        Type type = propertyInfo.DeclaringType;

        DynamicMethod dm = new("CopyValue", null, CopyValueArgs);
        ILGenerator il = dm.GetILGenerator();

        il.Emit(OpCodes.Ldarg_1);
        il.Emit(OpCodes.Castclass, type);
        il.Emit(OpCodes.Ldarg_0);
        il.Emit(OpCodes.Castclass, type);
        il.Emit(OpCodes.Callvirt, propertyInfo.GetGetMethod());
        il.Emit(OpCodes.Callvirt, propertyInfo.GetSetMethod(true));
        il.Emit(OpCodes.Ret);

        copyValueDelegate = dm.CreateDelegate<CopyValueDelegate>();
        CopyPropertyValueDelegateDict.Add(propertyInfo, copyValueDelegate);
    }

    var copy = (CopyValueDelegate)copyValueDelegate;
    copy(source, destination);
}
NOTE: Chronologically this happened before my CodedOutputStream hack I talked about above. This is actually the real moment of my ILGenerator downfall.
This emits the same code as using expression trees, but at an almost ridiculously lower cost: my delegate creation time went from 1050 to about 70 ms, bringing the total time time AssignPointedAtValues() took to just about 770 ms, a 72% reduction.
.NET 8 and Quick JIT for Loops
C# is part of the .NET platform, and the way it works these days is that there is a new version released every year. Odd versions (7, 8, 9) are supported for 1.5 years, while even versions (6, 8, 10) are long-term support (LTS) releases with 3 years of updates. When a version’s support ends, it stops receiving updates, including security fixes, and Visual Studio starts giving you the evil eye for targeting a “deprecated” framework. The support for .NET 6, the version that MHServerEmu is currently targeting, will end on November 12, 2024. While we can live with VS annoying us slightly more than usual, not having security updates for potentially public-facing server software is unacceptable, so we had to get ready for November.
I had been testing this for some time now. Retargeting is as easy as changing the number from 6 to 8 in project files and pressing the “Build” button, but there were two issues that made me less enthusiastic about this forced upgrade.
The first one is admittedly rather silly: .NET 7 dropped the support for Windows 7, so by retargeting to .NET 8 we would be doing so as well. This is honestly not that big of a deal: the few Windows 7 enjoyers (0.37% of Steam users according to the August 2024 hardware survey) are probably getting used to their OS of choice no longer being supported, and if you really want to, you can retarget the server back to a legacy framework relatively easily.
The other one was much more severe though: for some reason, the exact same game database initialization code targeting .NET 8 ran 35% slower than in .NET 6, contrary to all claims of performance improvements that new .NET versions bring. Something was not right here, but it was difficult to pinpoint the exact issue by profiling.
Eventuallly I ran into a discussion on Stack Overflow started by somebody who was having a similar issue when upgrading to .NET 7. This massive performance degradation appears to be indirectly caused by a feature called On-Stack Replacement introduced in .NET 7. Here is an overview of what was happening:
-
When you build your project, your C# code is compiled to intermediate language (IL), also referred to as bytecode.
-
The runtime that executes your program uses just-in-time (JIT) compilation to compile IL to native code for the platform it is running on. This happens as the program is being executed.
-
There are cases when it takes more time to compile IL than to actually execute it, and if this code is only executed once, wasting too much time compiling it leads to an overall performance loss.
-
To mitigate this issue, a feature called tiered compilation was introduced to the JIT compiler in .NET Core 2.1. When a piece of code is executed for the first time, it is compiled quickly with minimal optimizations, which is called quick JIT. If the runtime detects that your code is executed often enough, it recompiles it with a higher level of optimization.
-
When quick JIT was first introduced, it had performance issues with functions containing loops, so it was disabled by default for those cases. .NET 7 changes apparently made this no longer necessary, so quick JIT for loops became enabled by default, even though the documentation still says the default behavior is equivalent to
false.
The game database initialization contains many intensive functions with loops that are executed only once. Because of this, most of them do not use quick JIT in .NET 6, making them compile to optimized native code on the initial run (which is their only run). In .NET 8, by default quick JIT is now applied to them, making them run in their less optimized form.
Turning quick JIT for loops off brought our code running on .NET 8 approximately back to .NET 6 levels. Turning quick JIT completely off gave us a noticable performance boost on both 6 and 8 (about 500 ms on my machine).
All of these optimizations brought full database initialization time from approximately 14500 ms to 8500 ms on average on my machine, an overall 40-42% boost.
Round 3: PropertyList
The final frontier of this optimization pass was always going to be the PropertyList data structure. Properties are everywhere in this game: heroes, villains, friendly NPCs, regions, powers, conditions, and more. This makes any changes made to this system more impactful, both in terms of performance gains and ways thing can go wrong.
Each PropertyCollection has two PropertyList instances backing it. One is called a base list, which contains all properties actually belonging to that collection. The other one is referred to as an aggregate list, and it contains properties from the base list aggregated (combined) with properties from all attached child collections. The simplest example of this would be an avatar with equipped gear: PropertyCollection instances of each equipped item are aggregated with the avatar’s own collection, which results in the base list containing properties inherent to the avatar entity itself, and the aggregate list containing a combination of the avatar’s base properties with all of the item properties.
Our previous PropertyList implementation was just a simple wrapper around Dictionary<PropertyId, PropertyValue>. It works well for simple lookups, but the game makes heavy use of all kinds of filtered property iteration, some of which require properties to be grouped by PropertyEnum (see the February 2024 report for more information on how properties work). Initially I tried using SortedDictionary<PropertyId, PropertyValue>, but its performance was not acceptable compared to a regular dictionary. The fastest and easiest to implement solution that would do the job turned out to be using the OrderBy() LINQ extension method for every iteration, which copies all data to a new collection and sorts it. While it did work, it was also stupidly inefficient, especially in terms of memory allocation. And when you consider that PropertyList iteration is also used for lookup methods, like PropertyCollection.HasProperty(), it starts getting just silly.
For this overhaul I took another look at the client implementation, aptly named NewPropertyList. While it does some things that do not translate to C# well, there is one core concept I adapted from it. In most cases properties are actually not parameterized: it is common that over a half or even all properties in a collection are basically combinations of PropertyEnum and PropertyValue. So instead of storing all properties in a single monolithic collection, it is actually more efficient to use a divide-and-conquer approach:
-
Each
PropertyEnumgets aPropertyEnumNodeinstance, which can be accessed by a hash table (aDictionary<PropertyEnum, PropertyEnumNode>in our implementation). -
Each
PropertyEnumNodeconsists of aPropertyValueand aPropertyArray, which is a collection ofPropertyId/PropertyValuepairs. A node is essentially a bucket for a specificPropertyEnum. -
When a node is created for an enum for the first time, the list checks whether or not the
PropertyIdthat is being set has parameters. If it does, a newPropertyArrayis allocated for it, and the id/value pair is added there. If it does not, the value is simply assigned to thePropertyValuefield. -
If an existing node containing a non-parameterized property is updated with another non-parameterized property, the value field is simply overwritten. If a parameterized property is added to a non-parameterized node, a new
PropertyArrayis allocated for this node, and both id/value pairs are added to it.
The end result in our best case scenario is that we do a single dictionary lookup and immediately get our non-parameterized value from the node, nice and efficient. And because most of the time properties are not parameterized, we get our best case most of the time.
When I was picking the backing data structure for our PropertyArray implementation, at first I looked again at what I tried before, Dictionary<PropertyId, PropertyValue and SortedDictionary<PropertyId, PropertyValue>. My thinking was that maybe sorted dictionaries will outperform hashed ones at smaller element counts, but this assumption was wrong: benchmarking revealed that hash dictionaries were faster in pretty much all circumstances in .NET 6, and almost on par in .NET 8. However, creating tens of thousands of dictionaries, each managing their own hash buckets, was too costly for this, so I looked for the simplest solution possible.
The one I ended up picking was List<PropertyPair>, with PropertyPair being a variation of KeyValuePair<PropertyId, PropertyValue> with an IComparable implementation that compares pairs by keys. We add pairs to the list in sorted order, which in practice is basically free, because the most common case for property assignment is copying them from another collection, where they would already be sorted.
Since our lists are often tiny (< 10 elements), for lookups we are using the simplest thing possible: linear search with early exit.
private int Find(PropertyId id, out PropertyValue value)
{
    int count = _list.Count;

    for (int i = 0; i < count; i++)
    {
        PropertyPair pair = _list[i];

        if (pair.Id == id)
        {
            value = pair.Value;
            return i;
        }

        if (pair.Id.Raw > id.Raw)
            break;
    }

    value = default;
    return -1;
}
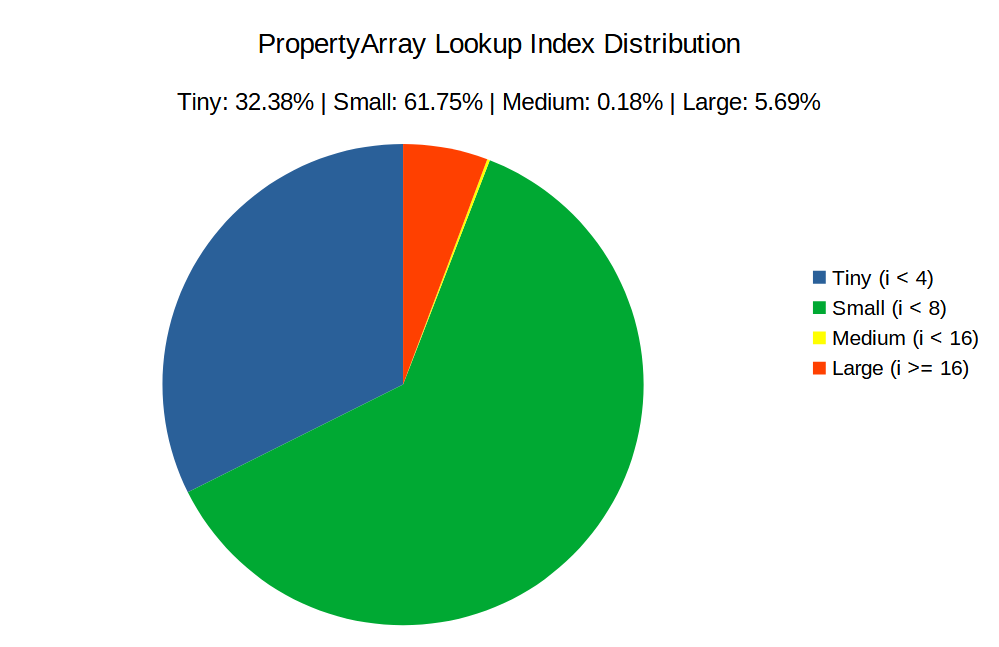
I did some measurements actually playing the game, and in the vast majority of cases (94.13%) this loop exits at i < 8, with a significant portion of them (32.38%) being at i < 4. Relatively costly lookups (i >= 16) were only 5.69%.
With usage like this, the simpler thing is actually more efficient than doing something more complex, like binary search. In theory it should also work better with the CPU’s branch prediction, making it even faster.
With all of that done, the new PropertyList implementation was almost a drop-in replacement for the old one. The only real major difference that had to be dealt with was the fact that the list can no longer be modified while it is being iterated, because we are now iterating the actual data instead of its copy. However, there were only two such cases in our codebase, and they were both very easy to fix.
And with that our optimization journey comes to an end. There are always more gains to be made, but for now I feel the server is in a much better state than it was a month ago, and now I can get back to implementing exciting gameplay features, such as conditions (buffs/debuffs) and loot system improvements.
Mission: Impossible
Time for a deep dive into missions, presented by AlexBond.
Hey everyone, it’s AlexBond. Let there be missions!
In this report I would like to share details on how I brought missions back to the game, and how it all works.
Mission Prototypes
The first thing to do was figuring out what prototypes are used for missions and how they are related to each other. Using the Game Database Browser, I determined the four main prototype classes:
-
MissionPrototype -
MissionObjectivePrototype -
MissionActionPrototype -
MissionConditionPrototype
There are various subclasses of MissionPrototype (OpenMissionPrototype, LegendaryMissionPrototype, DailyMissionPrototype, AdvancedMissionPrototype), but this time we will be looking at the base type.
The two primary groups of data contained in a MissionPrototype are MissionConditions and MissionActions. The former group defines events that need to tracked, while the latter determines what will happen when a mission’s state changes.
Here is an overview of how MissionPrototype data is used to interact with players and other objects in the game world:
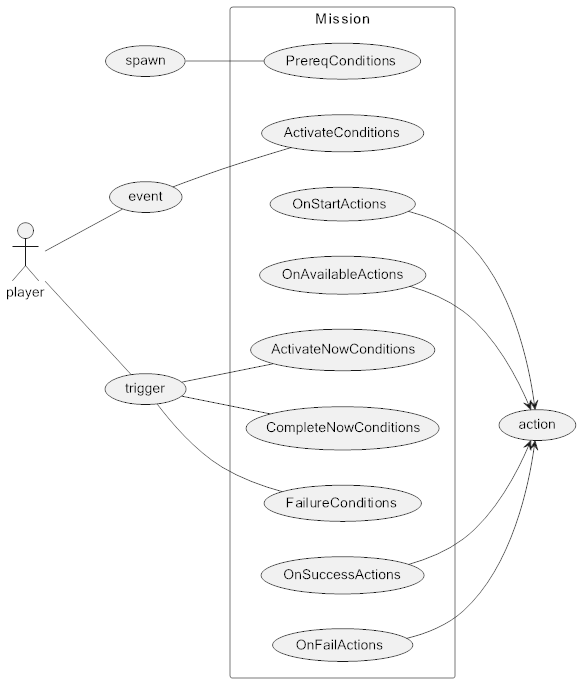
The are two varieties of MissionManager: one for regions, and one for player entities.
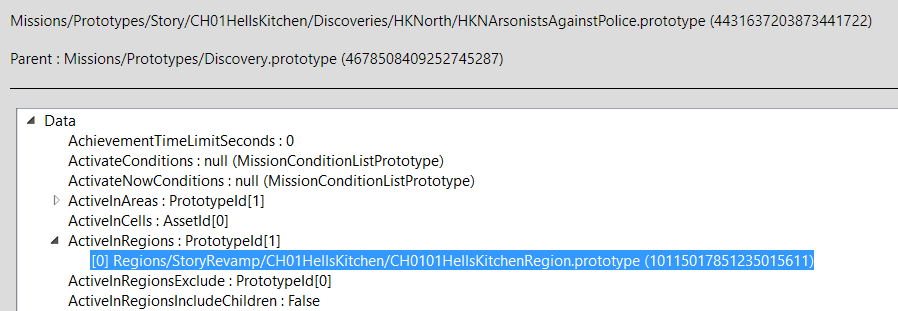
When a region is loaded, a global MissionManager is created and bound to that region. It then loads all OpenMissionPrototype instances that specify this region in their ActiveInRegions field.
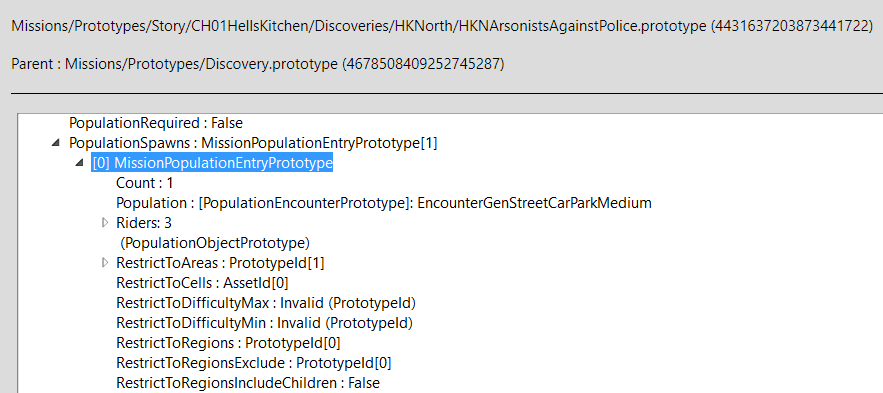
Also, as part of the region generation process, a function called GenerateMissionPopulation() is run, which takes population data from PopulationSpawns and forwards it to a MissionSpawnEvent (more on that later).
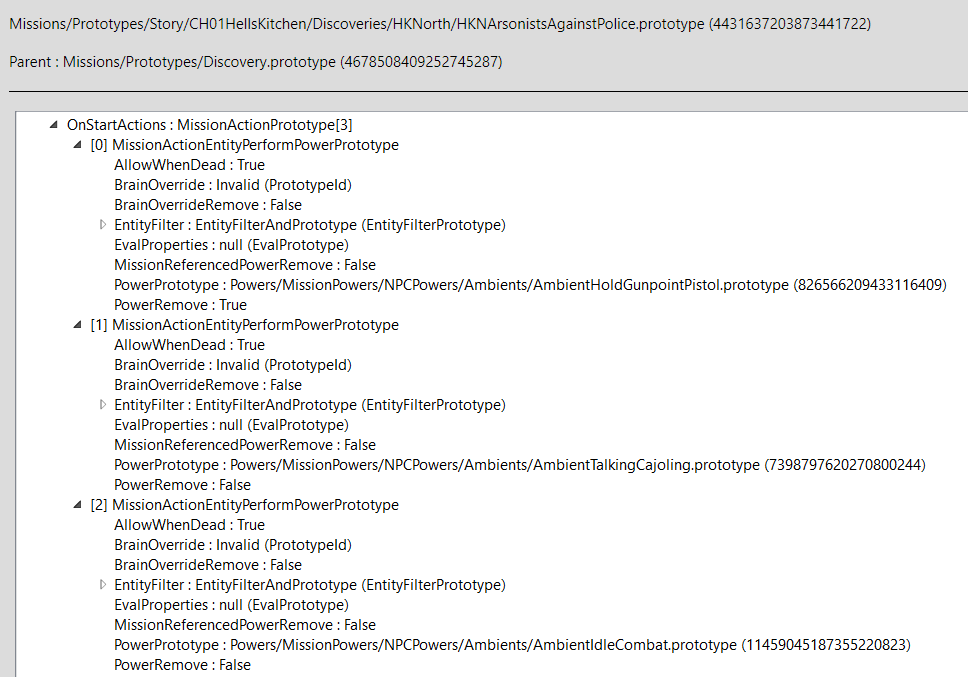
After the region finishes loading and spawning all required objects, the mission’s state changes to active, and the OnStartActions event is invoked, which mainly activates various ambient animations for NPCs and mobs using MissionActionEntityPerformPowerPrototype.
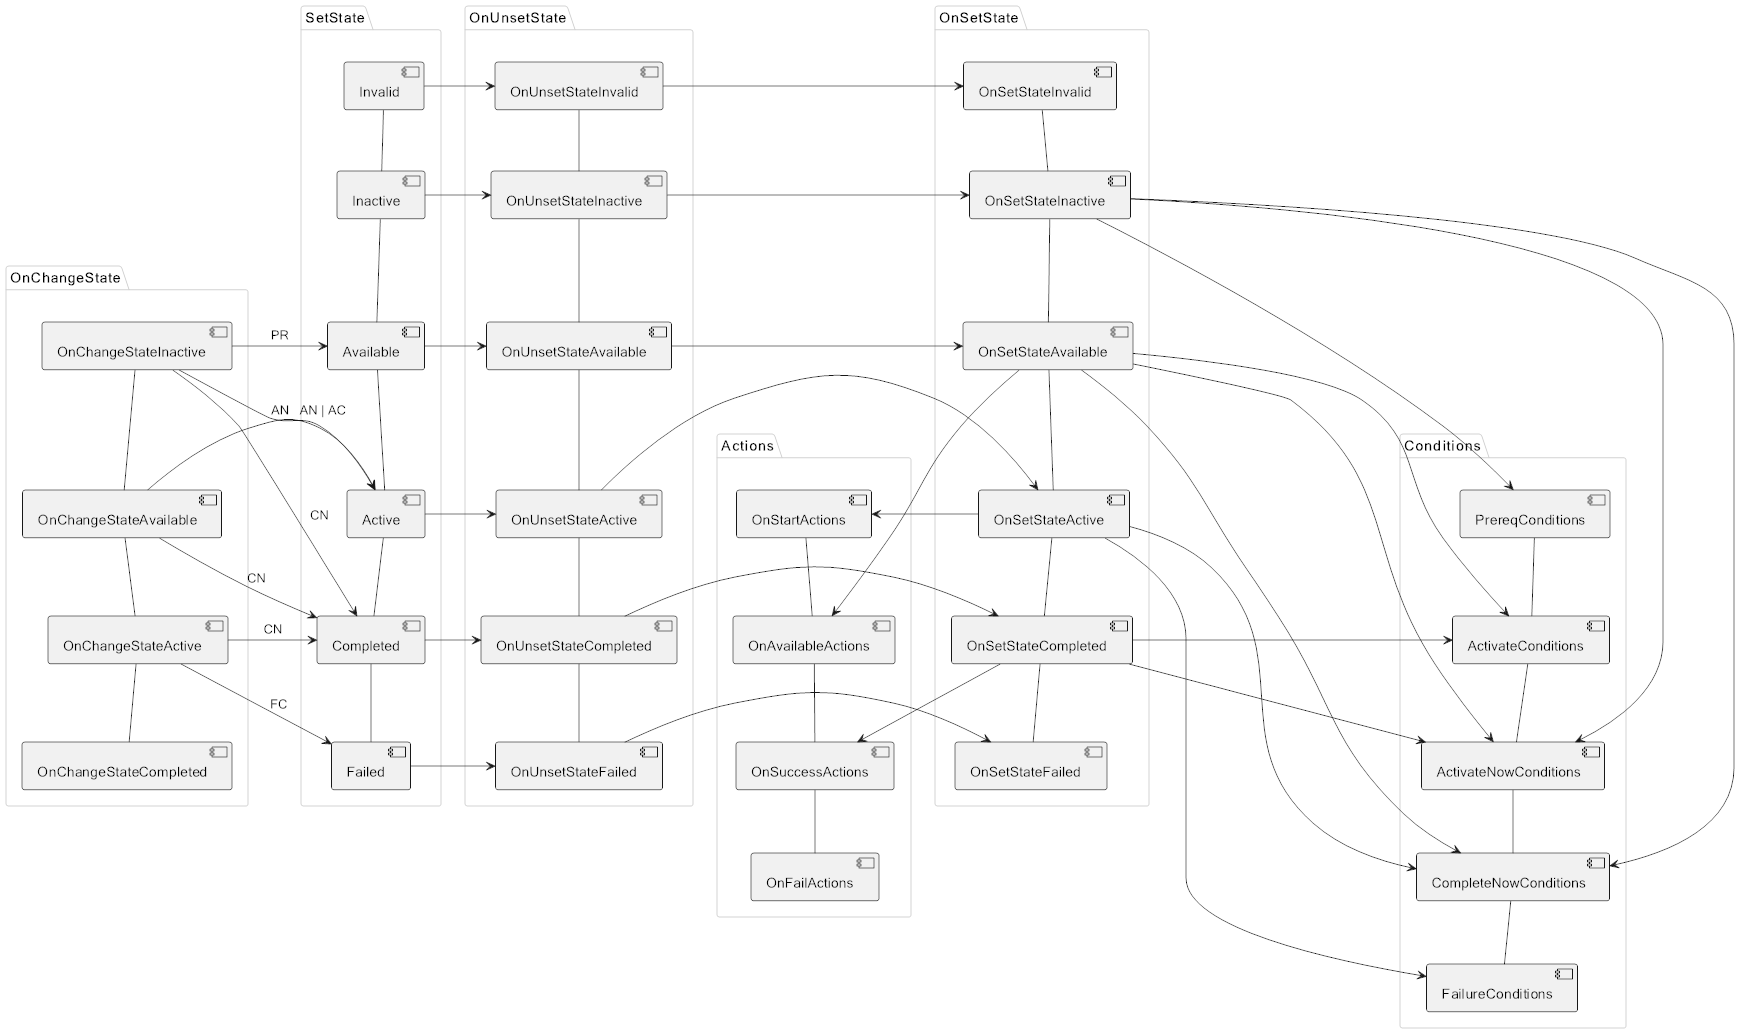
Each mission has a MissionState that switches in the following order:
Invalid - Inactive - Available - Completed - Failed
The switching process is very complex, so I will not be going into detail on how it works. Instead, here is a flowchart:
MissionObjective
Each mission contains a collection of objectives. MissionObjective has some differences from Mission, but overall they are very similar:
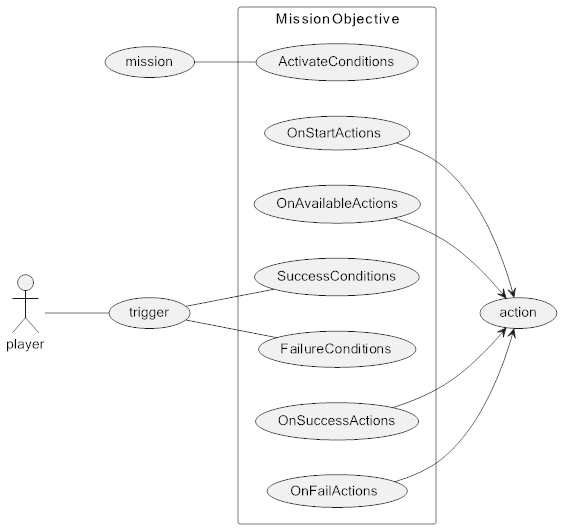
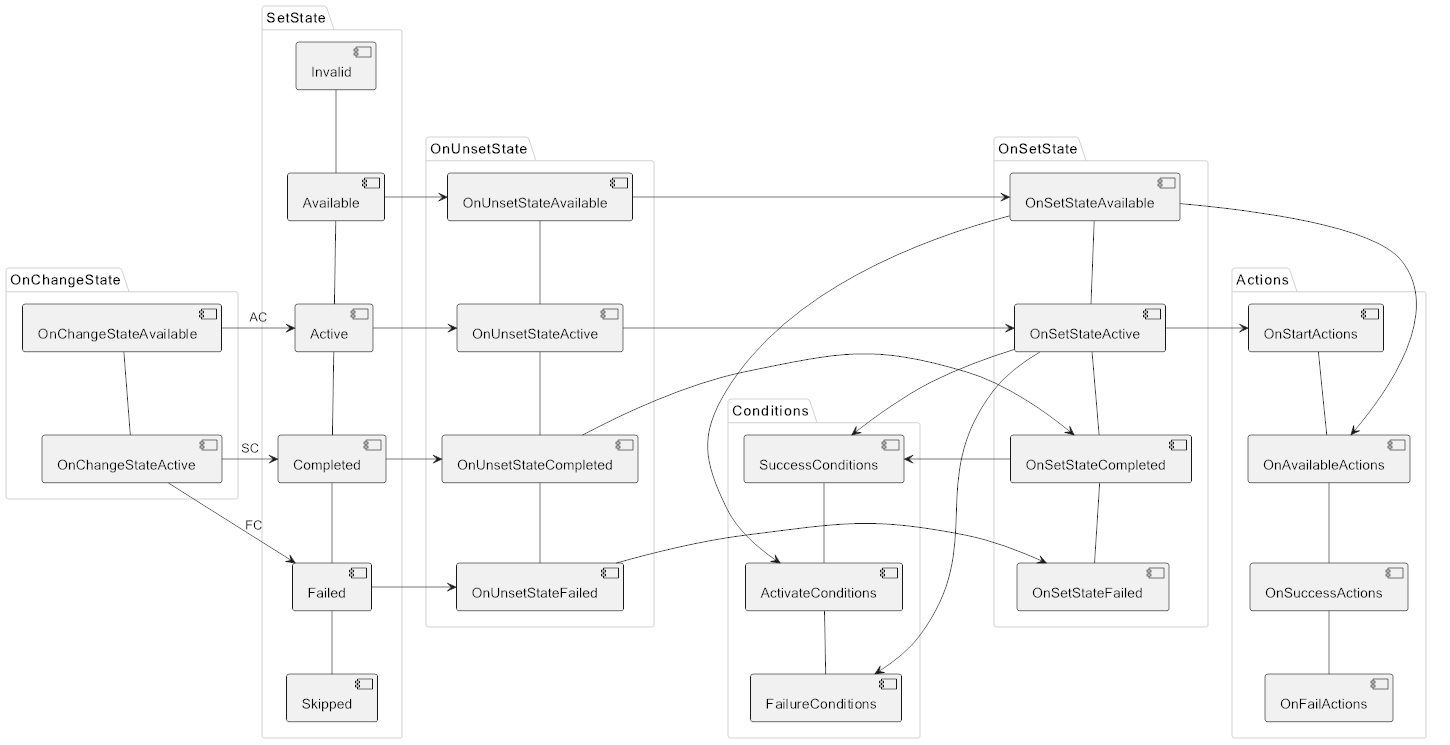
When a mission is activated, it switches all of its objectives to the Available state. This registers events for triggers and creates all the required actions and conditions. When an objective’s state changes to Active, its SuccessConditions start being tracked.
All objectives are completed in order, and more often than not their success condition is the completion of another mission. MissionObjectiveState switching process is similar to MissionState, but there are some differences. Here is a diagram of this process:
Now that we have “figured out” all the complexities, it’s time to take a look at how it all works in the game in the context of the story mode.
Story
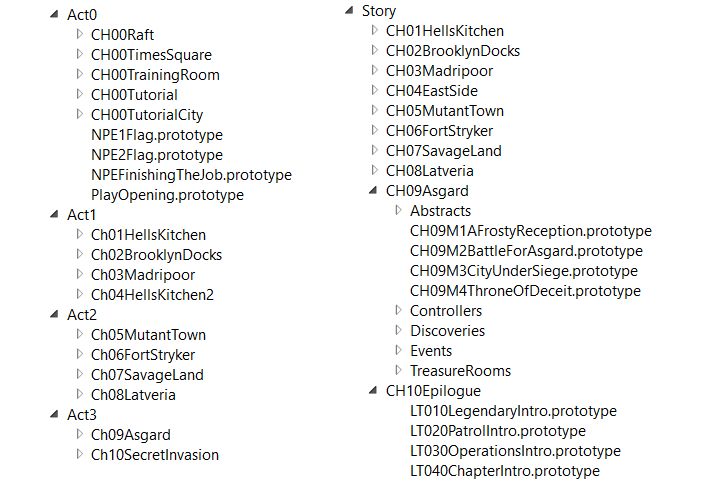
The game went through a lot of rewrites: many patches came out, the story mode underwent changes, content was removed, gameplay systems were reworked. Because of this, the prototypes are a mess of working and deprecated missions mixed together. Some missions have conflicts with one another, and others do not work at all. Let’s take a look at this:
As you can see, we have two mission directories, and many missions are duplicated and/or have conflicts… Sometimes it’s the Story missions that are the working ones, and sometimes it’s the ones from Acts…
Let’s take a look at an example of Story with Chapter 1.
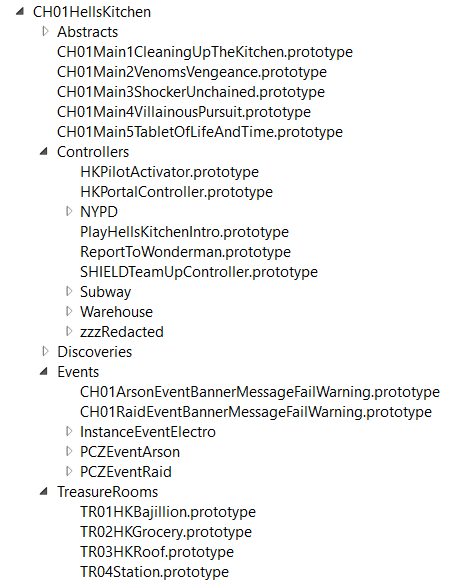
Missions are divided into Main, Controllers, Discoveries, and Events.
Each Main mission contains objectives:
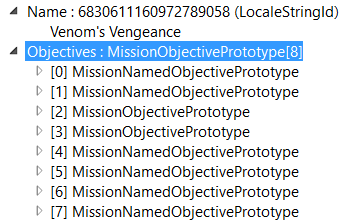
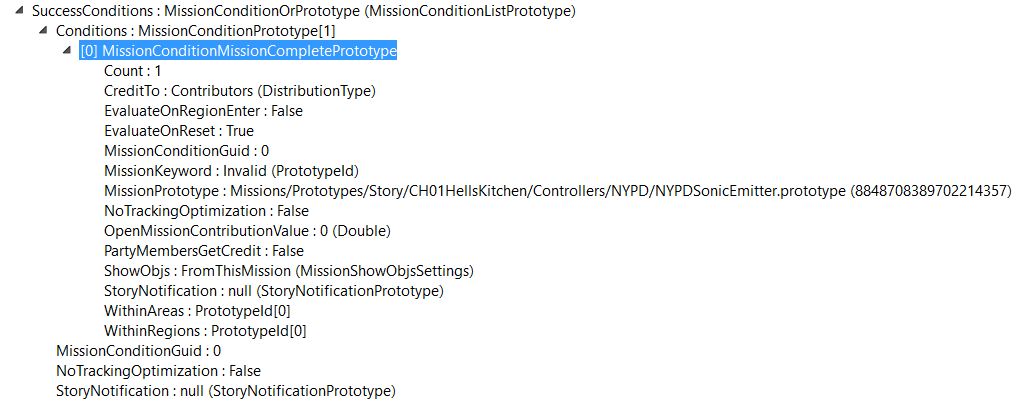
Let’s examine one of these objectives:
The completion of this objective requires the fullfillment of a MissionConditionMissionComplete for a controller (another mission) - NYPDSonicEmitter .
Within this controller there are three more conditions:
Controller missions in most cases manage a single boss, animation, or event.
Discovery missions activate triggers for discoverable mission objects on the map. They manage interactable NPCs that need to be saved or helped. All interactable NPCs on the map are Discovery missions.
Event missions start region events when a player comes near them.
In other words, MissionPrototype is essentially a form of scripting. Many smaller missions are restarted automatically.
All of the above was about region missions, now let’s talk about player missions.
Player Missions
Player missions start loading when a player with an active chapter enters a region. In total there are 303 such missions. They are saved per account and represent a player’s story progress. Many of them have the SaveStatePerAvatar flag and are saved in property collections of each avatar separately, which is what allows you to play through the story from beginning to end as each hero separately.
When I was testing the story, these missions were enough to get me to chapter 5, where I encountered MetaGames with no way forward without implementing them.
MetaGames
MetaGames are sets of global events for a given region that run on timers. Each MetaGame has a MetaGameMode and various MetaStates. The start of a MetaGame event usually creates a UI widget that looks like this:

Here is a list of modes that exist:
| GameMode | |
|---|---|
| MetaGameMode | Story |
| MetaGameModeIdle | TrainingRoom |
| MetaGameModeShutdown | Challenges |
| MetaGameStateMode | Story |
| NexusPvPMainMode | |
| PvEScaleGameMode | Limbo |
| PvEWaveGameMode | |
| PvPDefenderGameMode | PvP |
As you can see, the story uses only two modes. It also requires a number of states: MetaStateMissionActivate, MetaStateMissionSequence, MetaStatePopulationMaintain, and MetaStateWaveInstance.
Here is a full list of all states:
| MetaState | |
|---|---|
| MetaStateCombatQueueLockout | Raids |
| MetaStateEntityEventCounter | XMansion, Holo-Sim |
| MetaStateEntityModifier | XMansion, Holo-Sim |
| MetaStateLimitPlayerDeaths | Gate, Raids |
| MetaStateLimitPlayerDeathsPerMission | SurturDebugMainMode |
| MetaStateMissionActivate | |
| MetaStateMissionProgression | Raids |
| MetaStateMissionRestart | AxisRaid |
| MetaStateMissionSequence | |
| MetaStateMissionStateListener | XMansion |
| MetaStatePopulationMaintain | |
| MetaStateRegionPlayerAccess | |
| MetaStateScoringEventTimerEnd | DangerRoomTimerEnd |
| MetaStateScoringEventTimerStart | DangerRoomTimerStart |
| MetaStateScoringEventTimerStop | DangerRoomTimerStop |
| MetaStateShutdown | DangerRoom |
| MetaStateStartTargetOverride | SurturStartTargetCaldera |
| MetaStateTimedBonus | AgeOfUltronTimedBonusPhase01 |
| MetaStateTrackRegionScore | DangerRoom, AgeOfUltron |
| MetaStateWaveInstance |
I had to implement the required modes and states to continue working on missions.
Many of these states contain populations that need to be spawned dynamically using MetaStateSpawnEvent. This is what we will be looking at next.
SpawnEvent
The old spawning system I was using became no longer suitable for current circumstances. I had to rework it, which involved creating the following classes:
-
SpawnEvent(PopulationAreaSpawnEvent,MissionSpawnEvent,MetaStateSpawnEvent) -
SpawnScheduler(MarkerScheduler,LocationScheduler) -
PopulationObjectQueue(CriticalQueue,RegularQueue) -
SpawnLocation -
SpawnMap(to be implemented)
All the information we need for spawning is contained in PopulationObject, but it needs to be retrieved and processed correctly. Previously I did this manually, which is why everything was static. However, the game requires dynamic spawning.
Here is how it’s done. First, the SpawnEvent type is determined, which then processes our population by getting all PopulationObject instances from it. Objects are divided based on their properties by how critical they are for spawning and how tied they are to a location. Critical objects are spawned first, and while we have even a single critical object for a marker, none of the non-critical objects should be spawning (this caused a lot of issues with missions). If there is a UsePopulationMarker marker, the object is forwarded to a MarkerScheduler, otherwise it goes to a LocationScheduler.
First, we check if the region has a free marker using SpawnMarkerRegistry, and if it matches our SpawnLocation, this marker becomes reserved, and our object spawns on it. The number of markers in a region is limited, which causes problems, because the spawn queue is very large. To solve this issue, I have implemented two classes: PopulationObjectQueue and SpawnScheduler. They manage the queue and keep everything in order, preventing missions from breaking.
When all SpawnEvent objects are spawned, the OnSpawnedPopulation event is invoked, which activates the mission. If the marker is occupied, the required mission objects fail to spawn, and the mission does not activate.
This chart demonstrates how spawning is planned:
Conclusion
As you can see, missions are a very complex system of interconnections, states, conditions, and events. This makes it difficult to find the reason something breaks and understand it. Although I was able to fix the most glaring issues, and right now it is possible to finish all 10 chapters of the story, there is still a lot of work to do, including debugging internal missions, MetaState, widgets, animations, rewards, SpawnMap, and so on.
Thank you to everybody who is helping me debug missions, and until we meet again in future reports!
This was a huge one! Thanks to everyone who read (or just scrolled) all the way to the end, see you all next time!
